Toxic Levels of Concern
When you are modeling a chemical release in ALOHA and you want to assess the toxicity threat, you must choose one or more toxic Levels of Concern (LOCs). A toxic LOC tells you what level (threshold concentration) of exposure to a chemical could hurt people if they breathe it in for a defined length of time (exposure duration). Generally, the lower the toxic LOC value for a substance, the more toxic the substance is by inhalation*. Toxic LOCs also may be referred to as exposure limits, exposure guidelines, or toxic endpoints.
ALOHA's Default Toxic Levels of Concern
ALOHA is used primarily for emergency response or planning situations, where the goal is to assess the threat posed to the general public by a chemical release. For toxic releases, ALOHA uses public exposure guidelines preferentially for the default toxic LOCs, because these guidelines are specifically designed to predict how the general public will respond to a short-term, one-time release. The most common public exposure guidelines (AEGLs, ERPGs, and TEELs) all have three tiers of exposure values for each covered chemical. There are some key differences between the different types of exposure guidelines; however, at a very general level, the tiers are similar: the first tier (e.g., AEGL-1) is a mild effects threshold, the second tier (e.g., AEGL-2) is an escape-impairment threshold, and the third tier (e.g., AEGL-3) is a life-threatening effects threshold. ALOHA determines its default toxic LOCs based on the following hierarchy:
- AEGLs are used preferentially because they are the best public exposure LOCs to date. They undergo a rigorous review process, have multiple exposure durations, and are designed as guidelines for nearly all members of the general public—including sensitive individuals. As part of the review process, interim AEGL values are established and then evaluated thoroughly (sometimes over several years) before the final AEGL values are approved. However, because the AEGL development process is so exhaustive, relatively few AEGLs have been finalized (about 175), and there are also about 80 interim AEGLs. (ALOHA only includes the AEGL values for a 60-minute exposure duration; go to CAMEO Chemicals to see the AEGL values for other exposure durations.)
- ERPGs are used next. They are based on experimental data, but—unlike AEGLs—they are only available for a 60-minute exposure duration and they are not designed as guidelines for sensitive individuals.
- PACs are used next. This dataset combines all three common public exposure guideline systems (AEGLs, ERPGs, and TEELs) and implements a hierarchy-based system for you. (AEGLs are used preferentially, followed by ERPGs, and then TEELs.) If ALOHA is defaulting to the PAC values, it means that there are no AEGL or ERPG values in the ALOHA chemical library for that substance. In this case, the PAC values will be the TEEL values. TEELs are derived using existing LOCs and by manipulating current data. This process is less intensive than the AEGL or ERPG process, and many more chemicals are defined under the TEEL system. By definition, TEELs are temporary limits designed to be used as exposure limits for chemicals for which AEGLs or ERPGs have not yet been defined.
- IDLH limits are used when no public exposure guidelines are defined for a given chemical. An IDLH limit is a workplace exposure limit that is used primarily for making decisions regarding respirator use. In the 1980s, before public exposure guidelines were available for most common chemicals, the IDLH limit was used in public exposure situations. For example, the Technical Guidance for Hazards Analysis (which was developed in 1987 by the Environmental Protection Agency and other federal agencies to provide guidance for hazard planning) primarily used 1/10th of the IDLH limit. However, unlike the three-tiered public exposure guidelines, only a single IDLH value is defined for applicable chemicals.
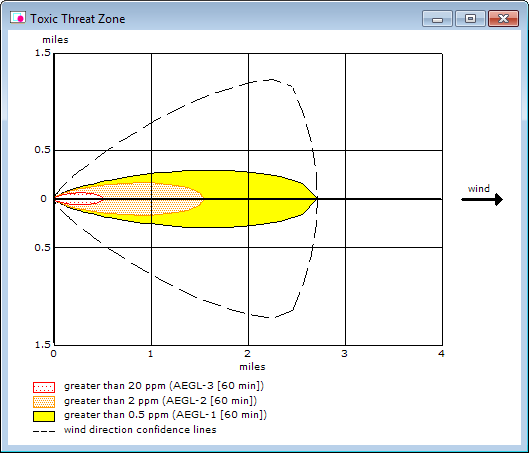
If you model a toxic vapor cloud scenario in ALOHA using the default public exposure guidelines as your toxic LOCs, your threat zone estimate will look similar to the one pictured below. The red, orange, and yellow threat zones indicate the areas where the ground-level pollutant concentration is predicted to exceed the corresponding LOC at some time after the release begins. Typically, the "-3" public exposure guideline values are used for the most hazardous (red) threat zones, because they represent the threshold concentration above which health effects may be life threatening.

Note: In most cases, the LOCs available on the Toxic Level of Concern dialog will be concentration threshold values based on toxicity. However, for some flammable chemicals, the LOCs may have been based on the Lower Explosive Limit (or some percentage of it). If you have questions about whether a particular LOC value is based on toxicity or flammability, you should refer to the documentation provided by the LOC developers. (For developer websites, see the AEGL, ERPG, PAC, and IDLH pages.)
Using Other Toxic Levels of Concern in ALOHA
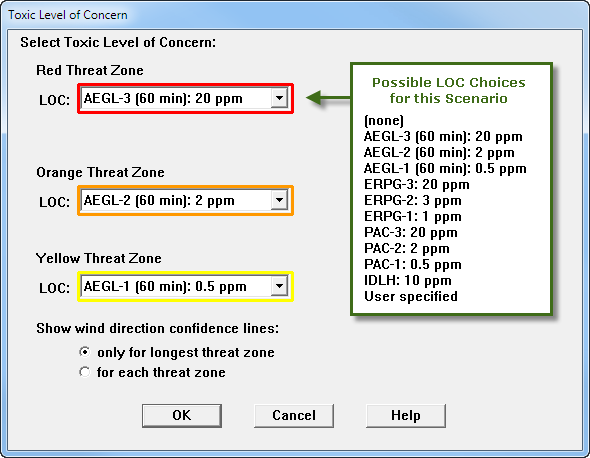
If you prefer, you can temporarily override ALOHA's default toxic LOC choices by using the drop-down lists on the Toxic Level of Concern dialog. You can choose LOCs that are lower in ALOHA's hierarchy—or you can choose "User specified" and then type in values of your own. (Note that the red threat zone LOC should be the highest value and the yellow threat zone LOC should be the lowest value.)

If you want to permanently override ALOHA's default toxic LOC choices, you can add default toxic LOC values to any pure chemical record in ALOHA's chemical library. For more information on setting your own LOCs, read the Ask Dr. ALOHA article on choosing toxic LOCs.
More Information about LOCs
- Ask Dr. ALOHA: Working with Toxic and Odor Thresholds: This article describes a scenario where a responder needs to assess a chemical release using both toxic and odor thresholds as LOCs in order to evaluate the threat posed to the public.
- Ask Dr. ALOHA: Working with the Concentration Graph: This article discusses exposure duration and how to use the concentration graph. The concentration graph shows indoor and outdoor concentrations of a chemical in the air at a specific location for one hour after the start of a chemical release.
 An official website of the United States government.