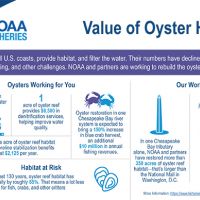
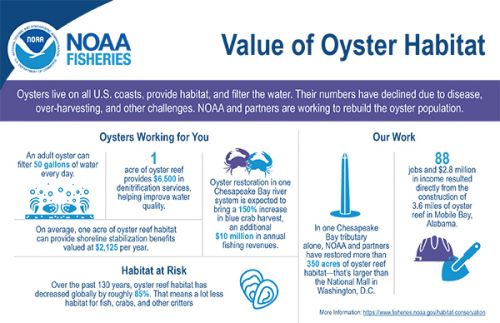
Infographic showing key numbers on the value of oyster habitat, overall decrease in oyster habitat in 130 years, and NOAA's work to restore the habitat.
([field_image_credit])Infographics
OR&R has created a variety of infographics to augment information on our website and to stand alone as information sources covering a range of topics. Feel free to use these with NOAA credit.
Value of Oyster Habitat
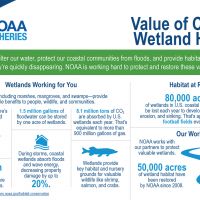
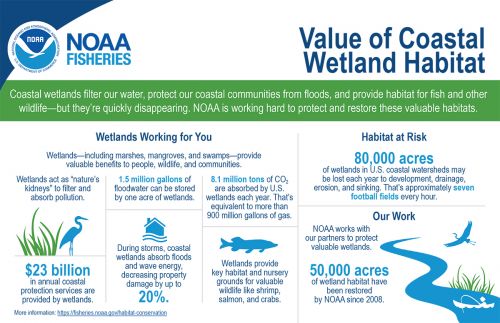
Value of Coastal Wetland Habitat
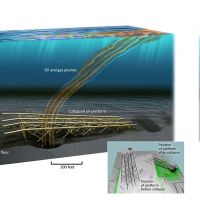
Illustrations of how the Taylor MC20 Platform in the Gulf of Mexico appeared before and after damage from Hurricane Ivan in 2004. The third panel shows the containment system installed to capture oil from persitant leaks.
([field_image_credit])Taylor Energy Platform

Illustrations of how the Taylor MC20 Platform in the Gulf of Mexico appeared before and after damage from Hurricane Ivan in 2004. The third panel shows the containment sytem installed to capture oil from persistent leaks.
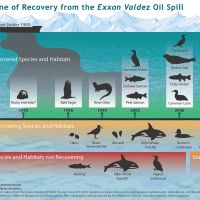
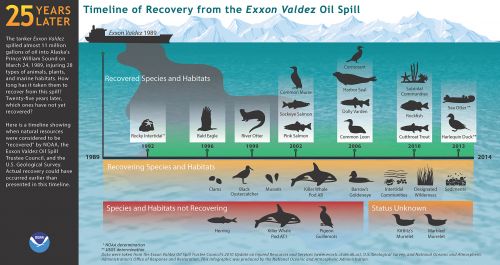
([field_image_credit])Recovery Timeline: Exxon Valdez Oil Spill
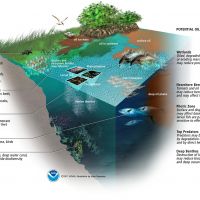
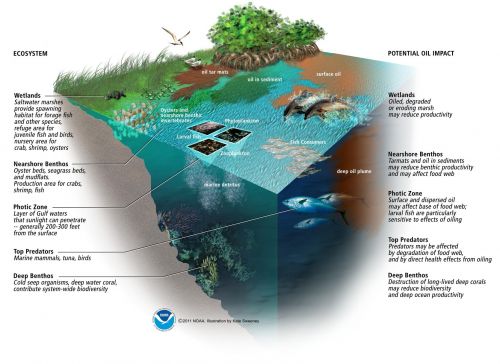
Deepwater Horizon Oil Spill - Potential impacts
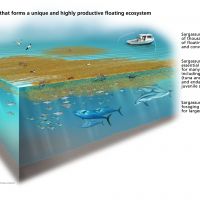
Sargassum: Floating Ecosystem
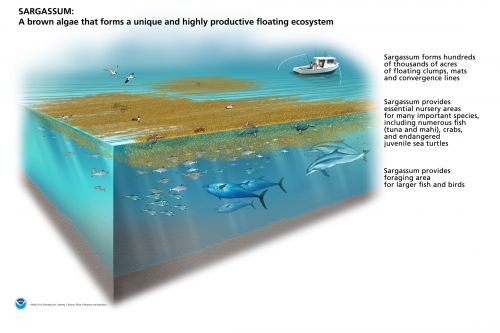
Section of marine environment showing sargassum, various fish and wildlife.
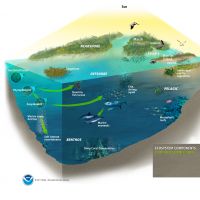
([field_image_credit])Ecosystem Components and Food Web - Gulf of Mexico
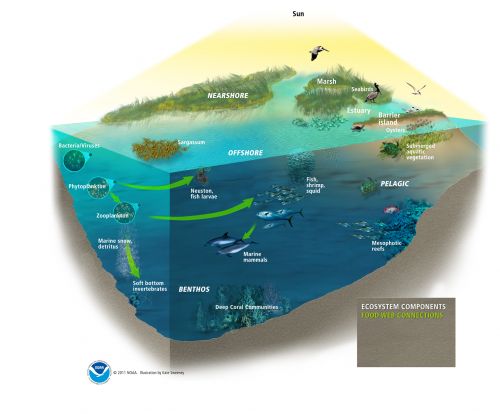
Diagram showing ecosystem components of nearshore, offshore, pelagic zone, and benthos in the Gulf of Mexico.
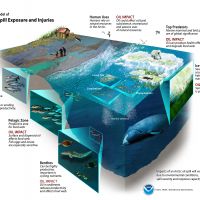
([field_image_credit])Conceptual Model of Arctic Oil Spill Exposure and Injuries
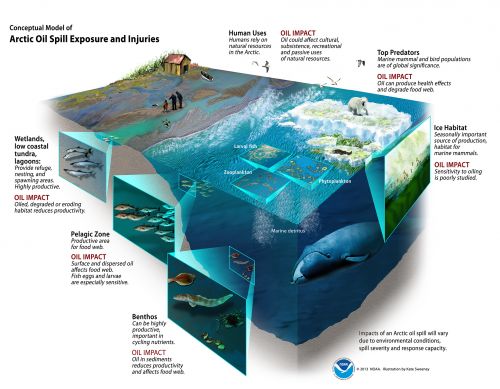
Cut-away illustration of wetlands, pelagic zone, and benthos.
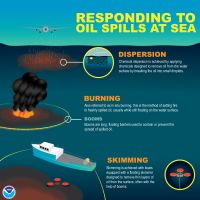
([field_image_credit])Responding to Oil Spills at Sea
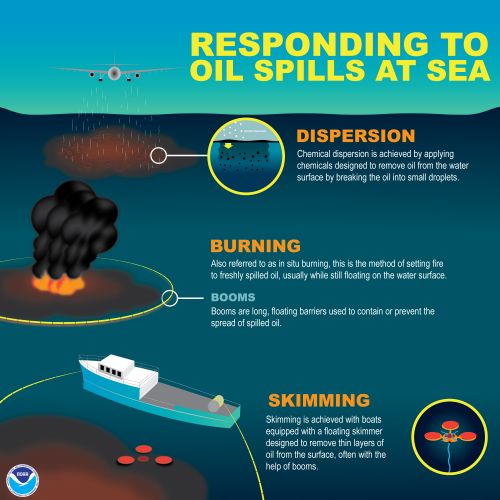
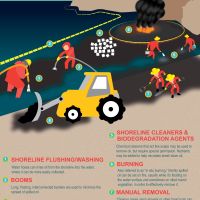
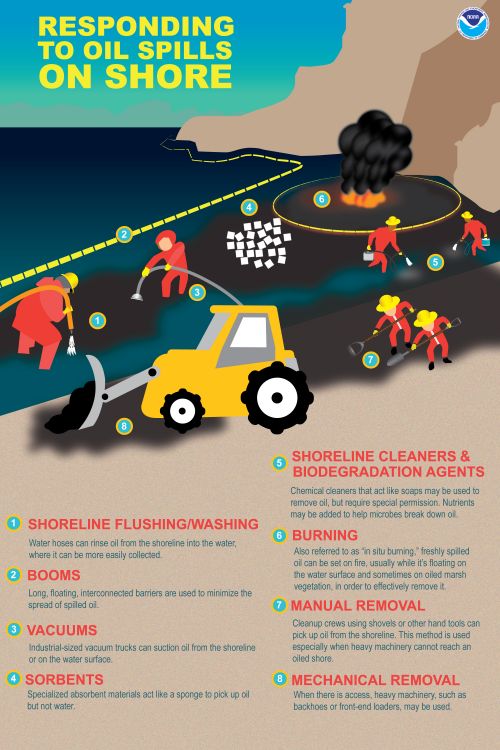
Responding to Oil Spills on Shore
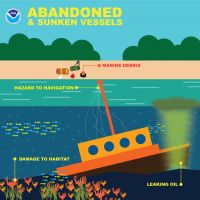
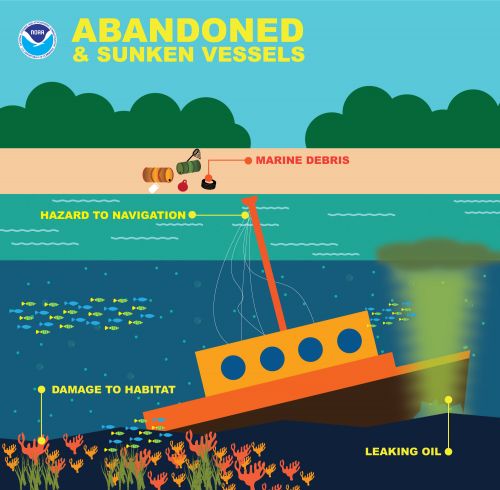
Abandoned and Sunken Vessels
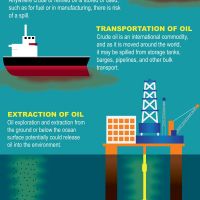
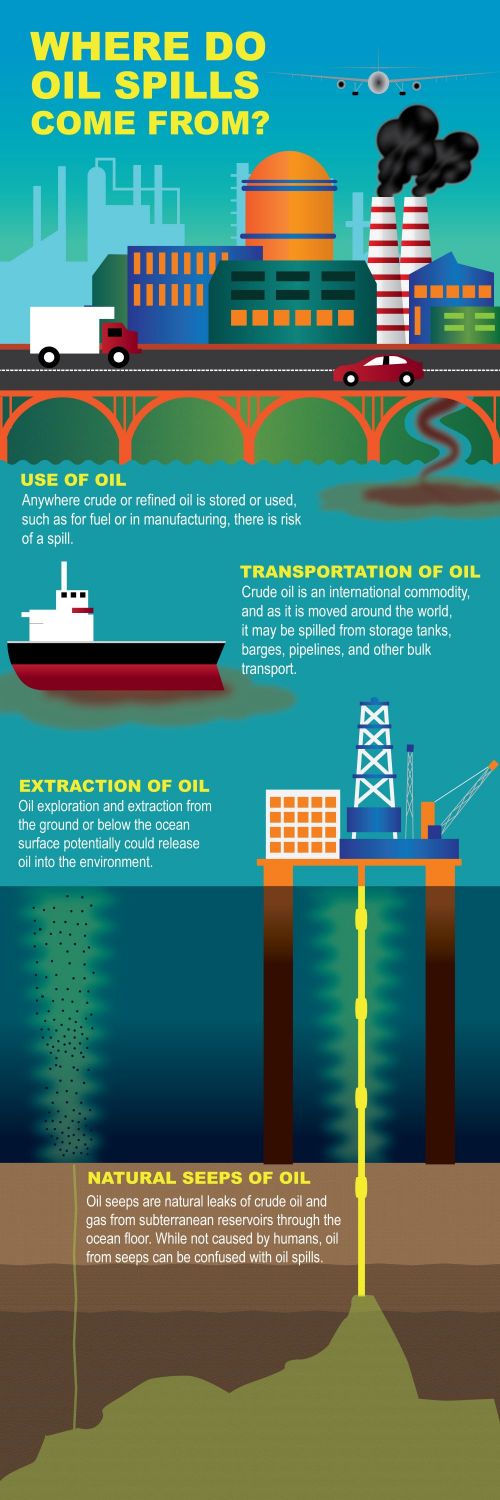
Where do Oil Spills Come From?
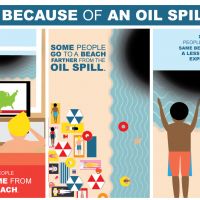
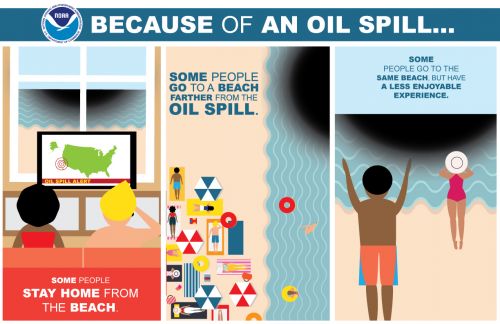
Because of Spills
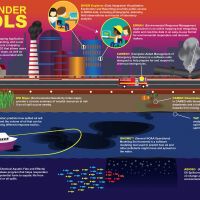
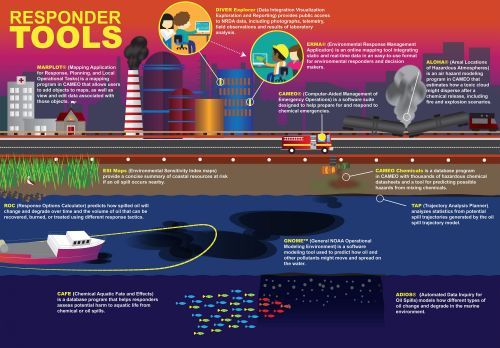
Responder Tools
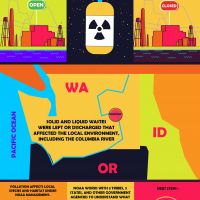
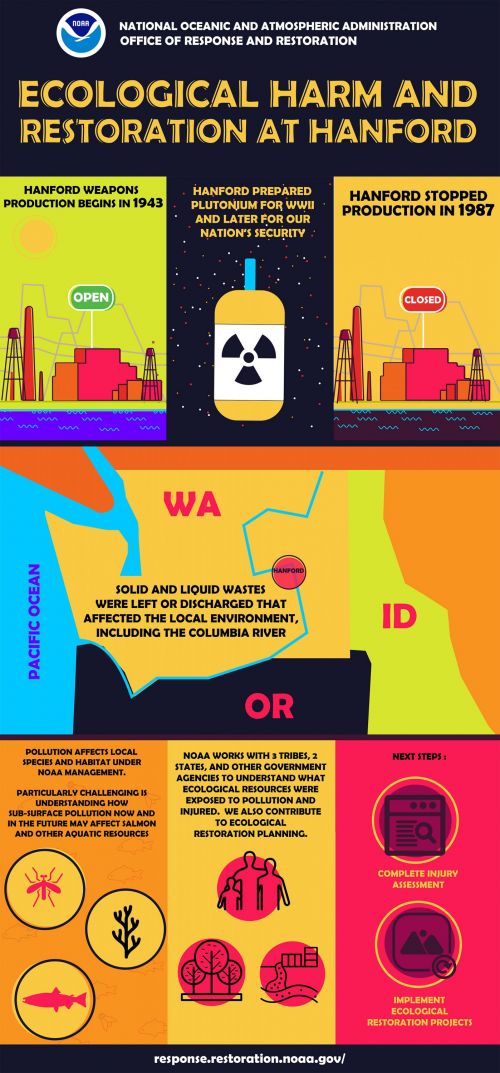
Ecological Harm and Restoration at Hanford
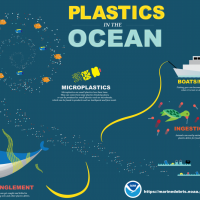
Plastics in the Ocean
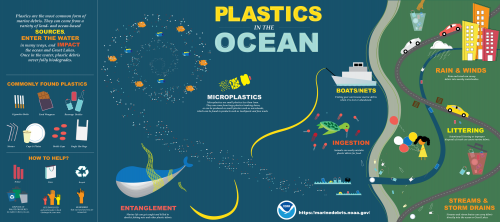
Information on the issue of marine debris.
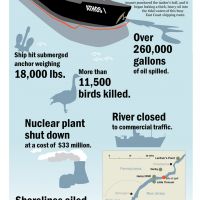
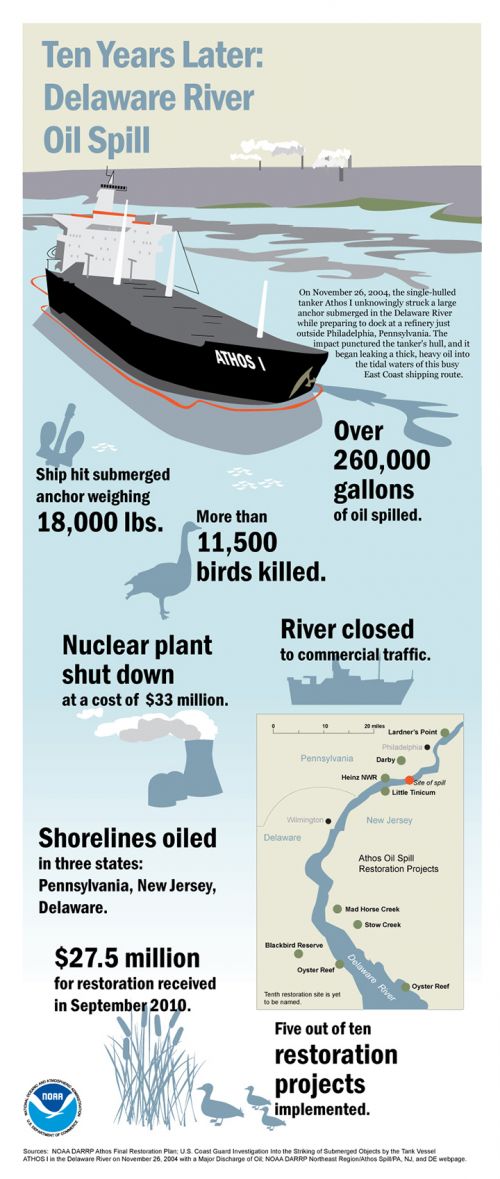
([field_image_credit])Ten Years Later: Delaware River oil Spill (Athos)
Largest Oil Spills Affecting U.S. Waters - 1969-2024

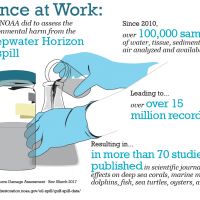
Science at Work: Deepwater Horizon Oil Spill

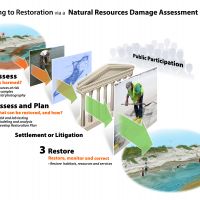
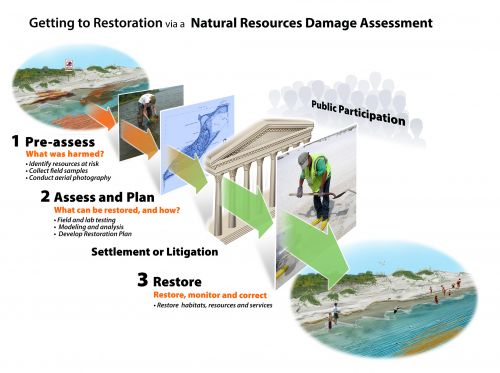
Getting to Restoration via a Natural Resources Damage Assessment
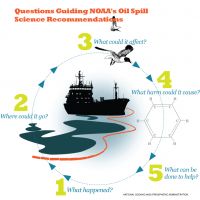
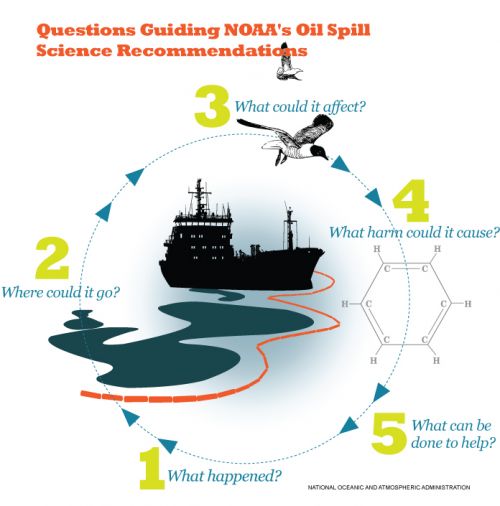
Questions Guiding NOAA's Oil Spill Science Recommendations
 An official website of the United States government.