Environmental Sensitivity Index (ESI) Maps and Data
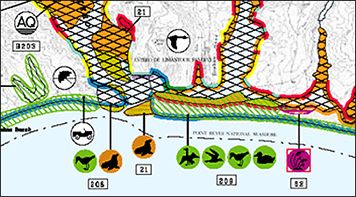
Environmental Sensitivity Index (ESI) maps provide a concise summary of coastal resources that are at risk if an oil or chemical spill occurs nearby. Examples of at-risk resources include biological resources (such as birds and shellfish beds), sensitive shorelines (such as marshes and tidal flats), and human-use resources (such as public beaches and parks).
When a spill occurs, ESI maps can help responders meet one of the main response objectives: reducing the environmental consequences of the spill and the cleanup efforts. Additionally, ESI maps can be used by planners—before a spill happens—to identify vulnerable locations, establish protection priorities, and identify cleanup strategies.
ESI maps and data are created by NOAA OR&R researchers, working with colleagues in state government agencies, federal government agencies, and industry. These maps and data would not be possible without the support of these regional resource experts.
Access the ESI Products
- Review ESI availability to learn what products are available in your region of interest.
- Download ESI maps and data in a number of formats.
Key Features of ESI Maps and Data
- Use GIS techniques to integrate maps of a region with geographically-referenced biological resources, human-use resources, and ESI-classified shorelines that are ranked based on their sensitivity to oiling.
- Contain a variety of associated attributes (such as seasonality and contact information) summarized in an attached map report for the paper and PDF maps, and in associated data tables that enable queries to the GIS data.
- Serve as a quick reference for spill responders and coastal zone managers.
- Are available as a single map, or a regional collection of maps called an ESI atlas.
- Are available in electronic formats (including several GIS formats) for most coastal regions of the U.S., as well as a few international locations.
More Information about ESI Maps
Basics: Learn about the basic elements of ESI maps, including the types of information that are mapped.
Toolkit: Browse a collection of resources for ESI users.
Availability: See the regions that have been mapped and available formats.
Sample ESI Atlas [PDF, 2.2 MB]: Review this sample ESI atlas, which includes an ESI map with seasonality data; background information about shoreline habitat ranking and sensitive biological and human-use resources; a list of species included in the atlas; a description of shoreline habitat types; a map legend; and guidelines for interpreting ESI maps.
Questions: Contact us with questions, comments, or suggestions about ESI maps.
 An official website of the United States government.
