ESI Toolkit
 This toolkit contains links to tools, resources, and information about Environmental Sensitivity Index (ESI) maps and data.
ESI Products
ESI maps and data are available in a variety of formats and can be downloaded for free. The maps can be viewed and printed, and the data can be used in
Download ESI Maps and GIS Data: Download maps and data in a number of formats.
Availability: Find out what regions have been mapped using the ESI method.
ESI Basics
These resources describe how ESI maps are developed and how to use them.
ESI Maps: Read an overview of ESI maps.
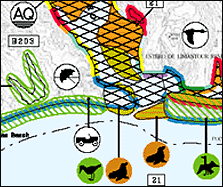
Anatomy of ESI Maps: Learn about the basic elements of ESI maps, including examples of the front and back of a map and an overview of how the maps are created.
Shoreline Rankings: Under the ESI method, shorelines are ranked according to their sensitivity to oil, the natural persistence of oil, and the expected ease of cleanup after an oil spill. In this series of pages, get an overview of the shoreline sensitivity rankings, a table of shoreline ranks, and an example of a shoreline ranked 10A.
Biological Resources: On ESI maps, the biological resources that are mapped include oil-sensitive animals and their habitats, and habitats that are themselves sensitive to spilled oil (such as coral reefs). In this page series, get an overview of biological resources and a table of symbols and patterns used to designate them.
Human-Use Resources: On ESI maps, the human-use resources that are mapped are resources and places important to humans and sensitive to oiling--such as public beaches and parks, marine sanctuaries, water intakes, and archaeological sites. This series of pages includes an overview of human-use resources and a table of symbols used to designate them.
ESI Tools
You can use the ESI tools to assist you in viewing and querying ESI atlases that have been published in geodatabase format. You can download them individually or all together in the ESI Toolbar. We recommend downloading the toolbar, because the tools complement each other.
ESI Toolbar: Overview of the ESI tools, and information on how to download the ESI Toolbar (which includes all of the ESI tools).
Query by Location Tool: This tool provides a drop-down menu of the available biology and human-use layers on the ESI map. After you select a layer, you can view the species or the types and names of the socioeconomic and management features present in a particular area. You may also set the fields in the biology and socioeconomic tables that you would like to view.
Query Biology by Attribute Tool: This tool allows you to query a biology layer by attribute (such as species, state and federal status, and monthly presence and/or breeding status). With this tool, you can locate species of special interest in a particular area, such as where a spill trajectory indicates that there may be heavy oiling.
Seasonal Summary Tool: This tool summarizes a region of interest and allows you to generate a text report, an 8.5 x 11 inch map layout, and a new geodatabase that contains the requested subset of feature layers and tables.
Report Generator Tool: This tool allows you to generate a Resource at Risk report, by exporting records you have selected in your biology table to a tab-delimited text file.
Metadata Viewer Tool: This tool launches your PDF viewer software and opens the metadata file associated with your ESI map. The metadata file is provided in the atlas directory transferred from the ESI CD/DVD.
ESI Documents and Resources
Each ESI atlas is a collection of ESI maps within a particular region, and for many people, having ESI coverage over an entire region is ideal. You also have the option of working with a subset of the maps available within an atlas.
Sample ESI Atlas [PDF, 2.2 MB]: This sample, from the 2007 ESI atlas for Alabama, includes a sample ESI map with seasonality data; background information about shoreline habitat ranking and sensitive biological and human-use resources; a list of species included in the atlas; a description of Alabama shoreline habitat types; a map legend; and guidelines for interpreting ESI maps.
ESI Guidelines: This in-depth report describes ESI mapping standards and how to implement them, as well as the rationale for developing data presentation standards.
ESI Metadata Templates: This page provides guidance and templates for those creating ESI metadata using the NOAA InPort platform.
GIS Overview: At this site, learn how people use GIS and geospatial technology and find links to resources that can help GIS users in their work.
ESI Photo Galleries
Shoreline Types (by ESI Rank): Photos of many major shoreline types listed in order of their ESI rank, from least sensitive to damage from spilled oil to most sensitive.
Questions: Contact us with questions, comments, or suggestions about ESI maps.
 An official website of the United States government.