Map of the Month: Remote Sensing/UXS
The Environmental Response Management Application (ERMA®) is NOAA’s online mapping tool that integrates both static and real-time data, enabling users to quickly and securely access, analyze, and display spatial data. The "Map of the Month" series highlights unique maps from throughout ERMA's use and history.
In partnership with the Bureau of Safety and Environmental Enforcement, NOAA and other public and industry partners entered into an interagency agreement to build upon remote sensing efforts undertaken in the Deepwater Horizon (DWH) oil spill. This agreement led to the DWH Lessons Learned Studies: Detection of Oil Thickness and Emulsion Mixtures using Remote Sensing Platforms.
The primary objective of this research was to compare the ability of multiple remote sensing platforms to detect and quantify surface oil, and verify that anomalies identified in remote sensing images corresponded with oil slick features that could be observed and quantified on a ship.
The results of this work supported the NOAA DWH findings that remote sensing data could supplement in field collections and provide useful information that represented actionable targets for clean up operations. This project has led to additional studies and methods development that now includes remotely operated vehicles (ROV) and autonomous underwater vehicles (AUV) examining the shallow mixing layers as well as surface extent.
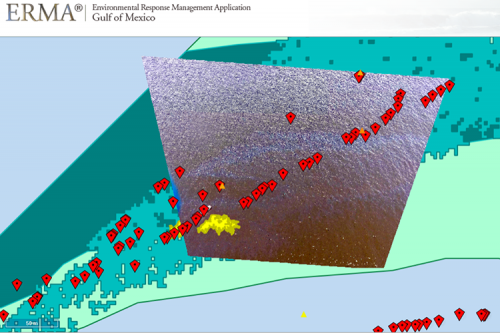
This ERMA map shows the mash-up of satellite, fixed wing and drone imagery and analysis paired with on-the-water collected thickness data. Satellite (Aster, Radarsat-2, and Worldview 2) image classifications (shades of green) represent thickness measurements from far above the earth, while drone imagery is overlain with drone classification (yellow), ship-board photography (red kites and inset) and in situ thickness measurements (triangles).
To learn more, view the map in ERMA here.
 An official website of the United States government.
