Map of The Month: Hurricane Dorian
The Environmental Response Management Application (ERMA®) is NOAA’s online mapping tool that integrates both static and real-time data, enabling users to quickly and securely access, analyze, and display spatial data.
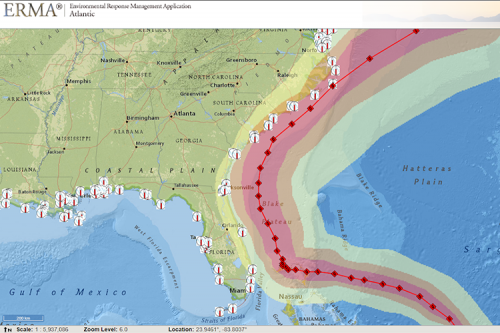
OCT. 23, 2019 —This map shows the path and wind speeds of Hurricane Dorian as it moved up the East Coast. Dorian first developed as a tropical storm on Aug. 24 in the Central Atlantic before devastating the Bahamas as a Category 5 hurricane on Sept. 2-3. Dorian’s trajectory slowed over the following days as it made its way northeast where it made landfall at Cape Hatteras, North Carolina on Sept. 6 — fluctuating between a Category 1 and Category 2 hurricane.
The red line and points along it track the strongest part of the storm, and the white circles represent water monitoring stations that provide a live feed of tides, currents, and water levels. These allow responders to anticipate and warn communities about dangerous storm surges.
The Environmental Response Management Application (ERMA) is used by NOAA, the U.S. Coast Guard, and other partners to provide up-to-date and visual information to guide emergency response decisions during hurricanes.
Click here to view the map online.
October’s Map of the Month comes from the Spatial Data Branch’s Adam Rotert in Silver Spring, Maryland.
 An official website of the United States government.
