Map of the Month: Huntington Beach Oil Spill and Environmental Sensitivity
The Environmental Response Management Application (ERMA®) is NOAA’s online mapping tool that integrates both static and real-time data, enabling users to quickly and securely access, analyze, and display spatial data.
On Oct. 2, 2021, NOAA was contacted by the U.S. Coast Guard regarding an oil spill off the coast of Long Beach, California. Quickly data started coming in as the size of the spill was evaluated. ERMA was utilized immediately as the common operational picture for the response and natural resource damage assessment.
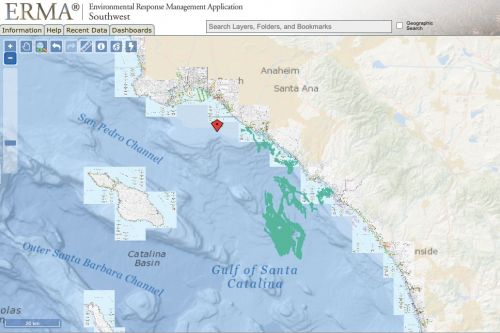
In the map above, ERMA is displaying the marine pollution surveillance reports (MPSR) from the satellite branch of NOAA's National Environmental Satellite, Data, and Information Service, which came in hours after first reports of oil being spilled. These green polygons depict where potential oil slicks have been observed across the days after the immediate spill.
In the map is the approximate spill location, shown with the red kite, and the environmental sensitivity index (ESI) data for the impacted area. ESIs depict sensitive shoreline, potential wildlife that can be present, as well as various habitats that are important to protect, such as Marsh or benthic habitats.
In the days to follow, the response grew as did the amount of data being collected. Teams were out collecting field data from samples, overflights, shoreline assessments, and teams tracking impacted animals.
All this information was aggregated into ERMA as the common operational picture and helps responders assess the efforts across the entire effort and plan where to allocate resources for the future.
Credit:
This "Map of the Month" is brought to you by Jay Coady, George Graettinger, and Megan Ewald from OR&R’s Assessment and Restoration Division. This map features data from NOAA-NESDIS marine pollution surveillance reports.
 An official website of the United States government.
