Explore Oil Spill Data for Gulf of Mexico Marine Life With NOAA GIS Tools
NOVEMBER 24, 2015 -- In the wake of the Deepwater Horizon oil spill, the sheer amount of data scientists were gathering from the Gulf of Mexico was nearly overwhelming. Everything from water quality samples to the locations of oiled sea turtles to photos of dolphins swimming through oil—the list goes on for more than 13 million scientific records. So, how would anyone even start to dig through all this scientific information? Fortunately, you don't have to be a NOAA scientist to access, download, or even map it. We have been building tools to allow anyone to access this wealth of information on the Gulf of Mexico environment following the Deepwater Horizon oil spill. We're taking a look at two of our geographic information systems tools and how they help scientists, emergency responders, and the public navigate the oceans of environmental data collected since the 2010 Deepwater Horizon oil spill. When it comes to mapping and understanding huge amounts of these data, we turn to our GIS-based tool, the Environmental Response Management Application, known as ERMA®. This online mapping tool is like a Swiss army knife for organizing data and information for planning and environmental emergencies, such as oil spills and hurricanes. ERMA not only allows pollution responders to see real-time information, including weather information and ship locations, but also enables users to display years of data, revealing to us broader trends.
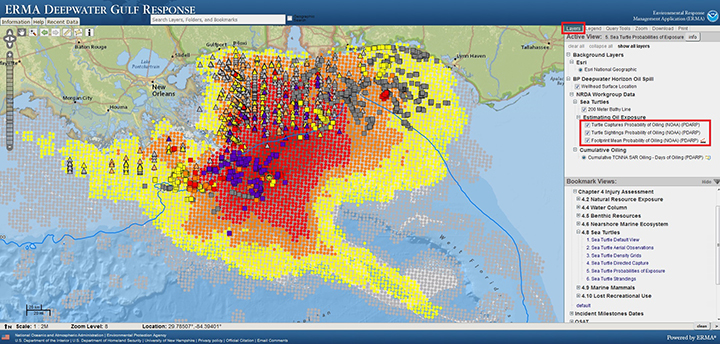
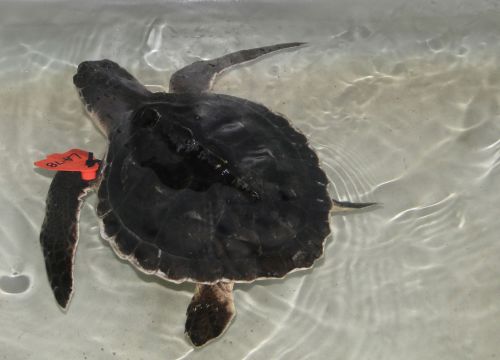
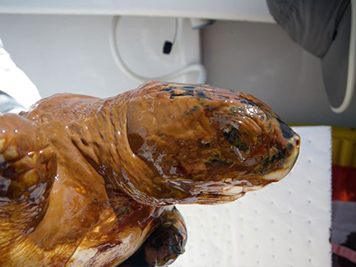
For instance, say you want to know the likelihood of sea turtles being exposed to heavy oil during the Deepwater Horizon oil spill. ERMA enables you to see where sea turtles were spotted during aerial surveys or captured by researchers across the Gulf of Mexico between May and September 2010. At the same time, you can view data showing the probability that certain areas of the ocean surface were oiled (and for how long), all displayed on a single, interactive map.
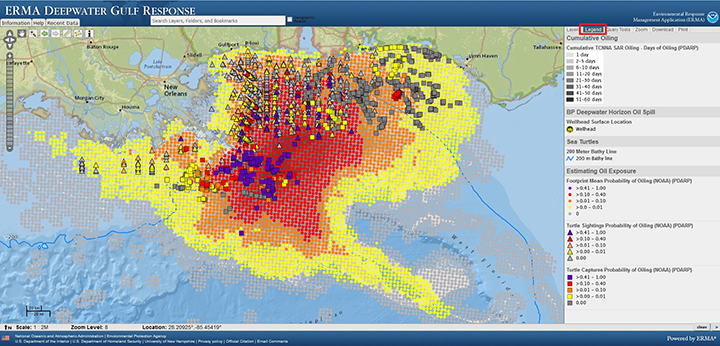
Perhaps you want to focus on where Atlantic bluefin tuna were traveling around the Gulf and where that overlaps with the oil spill’s footprint. Or compare coastal habitat restoration projects with the degree of oil different sections of shoreline experienced. ERMA gives you that access. You can use ERMA Deepwater Gulf Response to find these data in a number of ways (including search) and choose which GIS "layers" of data to turn on and off in the map. To see the most recently added data, click on the "Recent Data" tab in the upper left of the map interface, or find data by browsing through the "Layers" tab on the right. Or look for data in special "bookmark views" on the lower right of the "Layers" tab to find data for a specific topic of interest. Now, what if you not only want to see a map of the data, what if you also want to explore any trends in the data at a deeper level? Or download photos, videos, or scientific analyses of the data? That’s where our data management tool DIVER comes in. This tool serves as a central repository for environmental impact data from the oil spill and was designed to help researchers share and find scientific information ranging from photos and field notes to sample data and analyses. As Ocean Conservancy’s Elizabeth Fetherston put it:
Until recently, there was no real way to combine all of these disparate pixels of information into a coherent picture of, for instance, a day in the life of a sea turtle. DIVER, NOAA's new website for Deepwater Horizon assessment data, gives us the tools to do just that. Data information and integration systems like DIVER put all of that information in one place at one time, allowing you to look for causes and effects that you might not have ever known were there and then use that information to better manage species recovery. These data give us a new kind of power for protecting marine species.
One of the most important features of DIVER, called DIVER Explorer, is the powerful search function that allows you to narrow down the millions of data pieces to the precise set you’re seeking. You do it one step, or "filter," at a time.
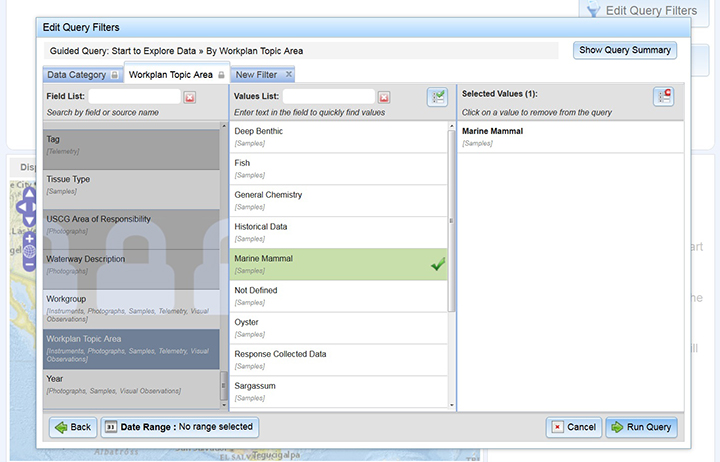
For example, when you go to DIVER Explorer, click on "Guided Query" at the top and then "Start to Explore Data," choose "By Workplan Topic Area," hit "Next," and finally select "Mammals" before clicking "Run Query" to access information about scientific samples taken from marine mammals and turtles. You can view it on a map, in a table, or download the data to analyze yourself. An even easier way to explore these data in DIVER, however, is by visiting https://www.doi.gov/deepwaterhorizon/adminrecord and scrolling down to and clicking on #5 Preassessment/Assessment (§§ 990.40 – 990.45; 990.51). This will reveal a list of various types of environmental impacts—to birds, sea floor habitat, marine mammals, etc.—which the federal government studied as part of the Deepwater Horizon oil spill's Natural Resource Damage Assessment. Say you're interested in marine mammals, so you click on 5.6 Marine Mammal Injury and then 5.6.3 Data sets. You can then download and open the document "NOAA Marine Mammal data related to the Deepwater Horizon incident, available through systems such as DIVER and ERMA, or as direct downloads. (September 23, 2015)." Under the section "Data Links," you can choose from a variety of stored searches (or "queries") in DIVER that will show you where and when, for example, bottlenose dolphins with satellite tags traveled after the spill (tip: zoom in to view this data on the map)—along with photographs to go with it (tip: click on the "Photos" tab under the map to browse).
This can tell us key information, such as the fact that certain populations of dolphins stay in the same areas along the coast, meaning they don't travel far from home. We can also look at data about whether those dolphin homes were exposed to a lot of oil, which would suggest that the dolphins that lived there likely were exposed to oil again and again. Both of these tools allow us to work with incredible amounts of data and see their stories brought to life through the power of geographic information systems. So, go ahead and start exploring!
